Download: Full Report PDF
Lab 1 — Signal in the Noise#
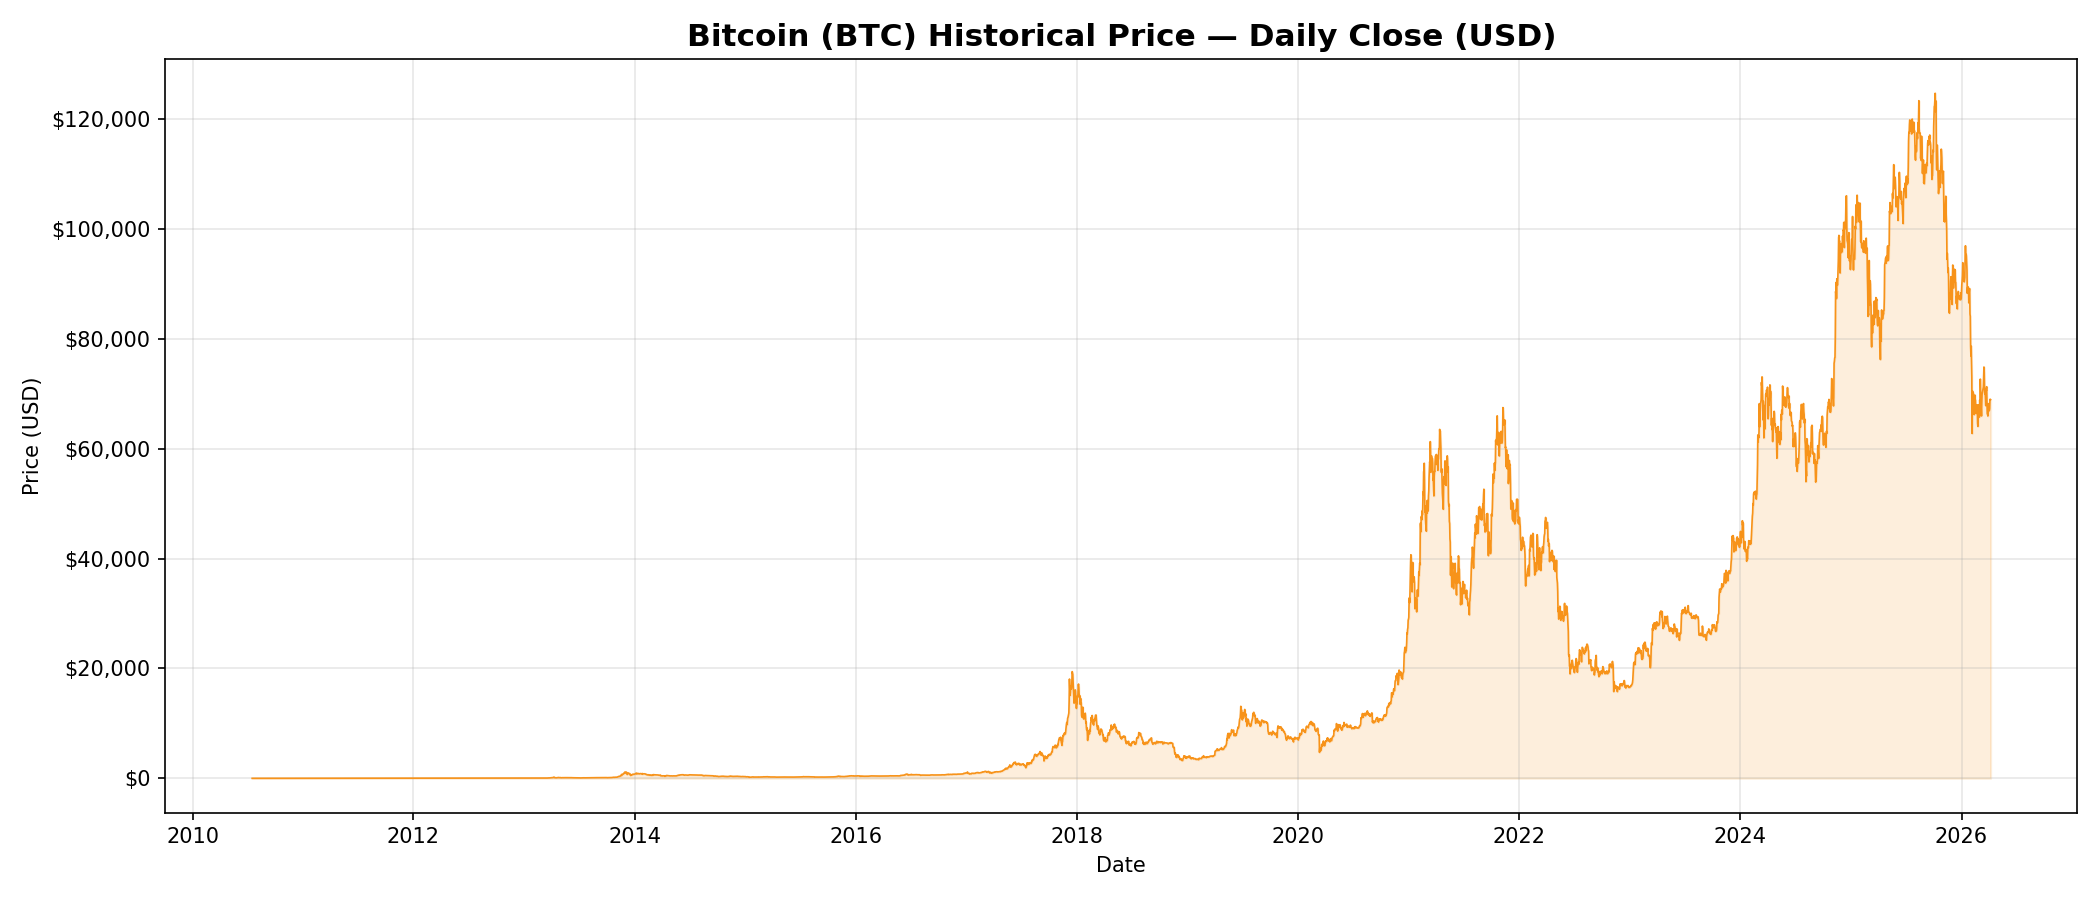
Objective: Build a minimal ML pipeline to detect Singularistic Events (SE) — big upside moves — in BTC price data.
Method: Logistic regression on a single feature: the 20-day rolling z-score.
z_score = (close - rolling_mean_20) / rolling_std_20Labels: SE_bull = 1 if max(close[t+1:t+20]) / close[t] - 1 > 3.1%
The 3.1% threshold clears slippage. Temporal train/test split (80/20) — no shuffling.
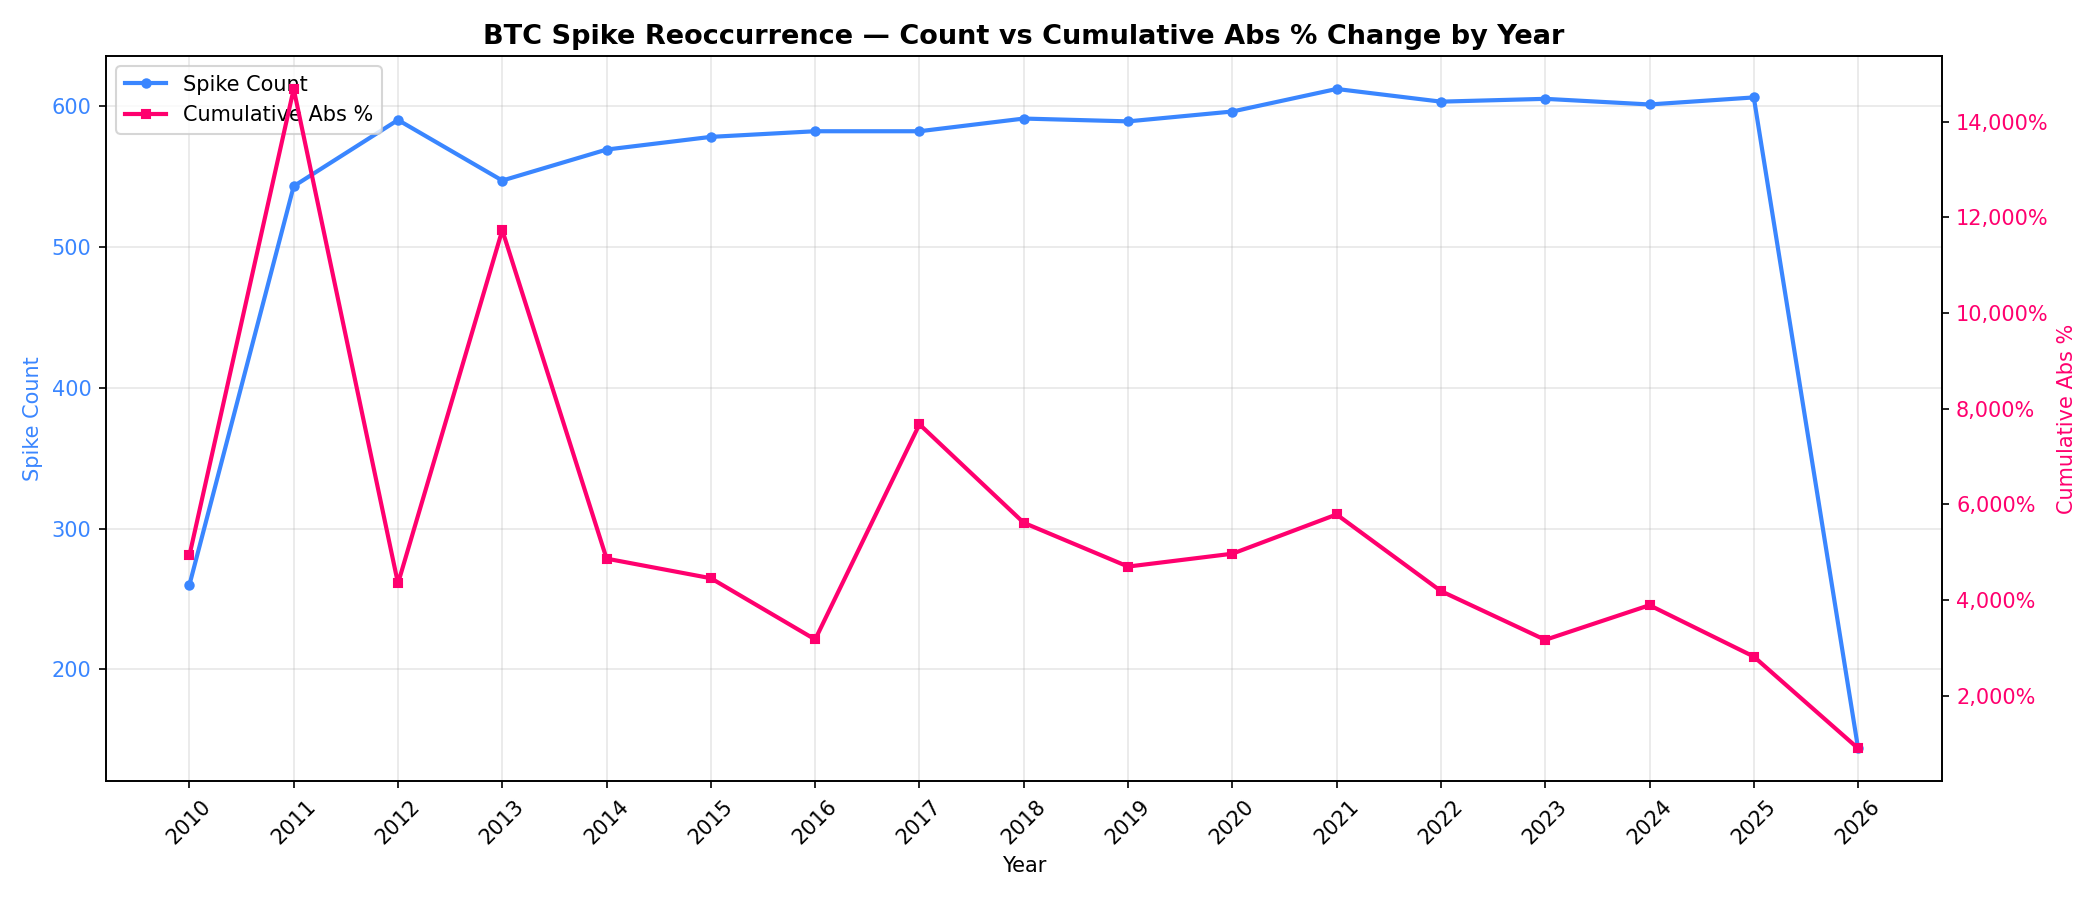
Key Finding: z-score alone is predictive. z=2–3 is the sweet spot before smart money front-runs the signal.
Lab 2 — Three-Strategy Regime System#
Objective: Map z-score bands to trading strategies using Expected Value tables.
| z-score band | p(win) | avg return | EV | Strategy |
|---|---|---|---|---|
| 0.0–0.6 | 67.5% | 17.4% | 11.8% | Dead zone — pass |
| 2.0–3.0 | high | high | max | Sniper |
| > 3.0 | drops | drops | drops | Too late — smart money is out |
Key Finding: z=2–3 is the sniper zone. Beyond z=3, front-running erodes edge.
Lab 3 — Volume as the Leading Indicator#
Objective: Test whether volume spikes precede z-score spikes, allowing earlier entry.
Hypothesis: Price is the aftermath. Volume is the cause.
Tested two volume signals as X2:
- Model A: Volume z-score > threshold
- Model B: Volume ratio (current vol / rolling mean vol)
Key Finding: Volume does spike before price — but it’s noisier than price z-score alone. Volume as X2 improves recall at the cost of precision. The timing advantage is real but modest.